Updated May 27, 2021
The CV19 Lab Testing DashboardTM powered by hc1 provides local lab testing insights that include state, county, and sub-county views of Local Risk Index, COVID-19 testing rates and results, and key demographic filters for those tested (age, gender). Data used in the dashboard comes from more than 20,000 lab ordering locations from a coalition of laboratories performing nearly 40 percent of the nation’s laboratory testing.
Below are weekly trends in number and percent positivity of viral and antibody testing gleaned from the dashboard’s data. Public health, public policy, healthcare, and laboratory professionals can access additional trends and demographic analysis by registering for free at cv19dashboard.org.

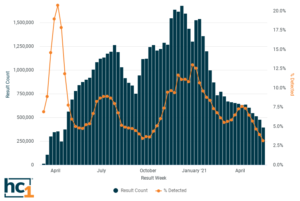
- The chart above shows the weekly national trend in SARS-CoV-2 Viral PCR testing volume and % Detected rate among the hc1 CV19 Coalition of Laboratories.
- Testing volume dropped again this week and has reached levels seen during April 2020.
- The percent positivity rate also decreased to about 3.0%.
- hc1 Local Risk Index trends for the week of May 26, show slight rising risk for infection in very few if any states.
- More insights into state, county and sub-county testing trends are available at CV19Dashboard.org.

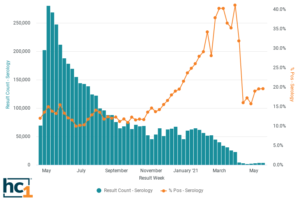
- The chart above shows the weekly national trend in SARS-CoV-2 Antibody Serology testing volume and % Detected rate among the hc1 CV19 Coalition of Laboratories.
- Antibody testing volume has significantly decreased over the past month, however remained consistent over the past few weeks.
- Percent positivity has also remained consistent at just below 20.0%.
- More insights into state, county and sub-county testing trends are available at CV19Dashboard.org

