


Update as of Mqy 24, 2021
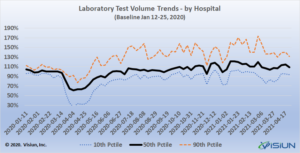
Visiun’s Performance Insight analytics solution collects data across the entire span of activities in hundreds of clinical laboratories of all types and sizes. This uniquely positions Visiun to accumulate data from participating labs and document trends and patterns that are happening regionally and nationally. Based on the number of tests performed, Visiun documented a collective drop nationally in daily routine test volume that commenced in early March 2020 and continues through the present
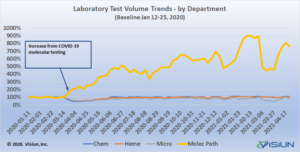
The chart above shows the range of test volume changes across laboratory departments, since the beginning of 2020.
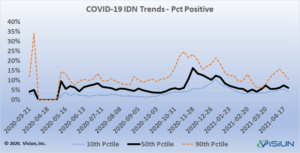 change in percent positive COVID antigen tests since testing began in March 2020.
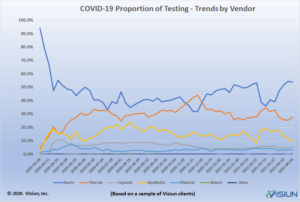
The chart above shows the relative change in proportion of COVID antigen tests by vendor since testing began in March 2020.
How this data was developed
Visiun was founded in 2010 and provides performance analytics software to the clinical laboratory profession. The data presented above was gathered from the daily testing activities of hundreds of labs across the country. Annually, labs using Visiun’s analytics solution, Performance Insight®, account for more than 500 million billable tests and 4 billion laboratory test results. Visiun mined this data to identify and present relevant insights about the changes in the volume of routine tests and COVID-19 tests performed by its client labs from the inception of the SARS-CoV-2 pandemic through the present.